2023 / Product
Luppa
Google Analytics for Employee Satisfaction
- Services:
- Product Development
- Design and User Experience

Overview
Luppa is an employee satisfaction and engagement analytics tool intended for all organizations that want to collect data and use employee satisfaction and engagement data to reduce employee turnover and improve satisfaction, engagement and productivity.
Its main products include:
Deep Dive: an extensive annual survey and report that helps employers understand the root problem, as well as top-performing segments of employee satisfaction and engagement.
Pulse: shorter, monthly surveys and reports to keep regular track of employee satisfaction and engagement trends throughout the year to help detect changes as they happen and take immediate action.
Custom survey: tailor-made surveys designed together with the client with the intention of gaining specific insights of their business.
We aimed to create technology that is stable, scalable, and easy to use, requiring minimal effort for development (low FTE number). The end goal was to enable quick iteration and innovation with a clean and user-friendly approach.
With the talent crisis on its high, employee experience, satisfaction, and engagement are more important than ever.
The Challenge
Although Luppa was a fast-growing SaaS startup with strong product-market fit and very strong SaaS metrics, the product itself was in an early stage with small funding, so efficiency, agility, and talent density were in focus.
For seamless execution, our team was organized in monthly and weekly sprints divided in 5 product groups: DeepDive, Pulse, Custom, Personal Luppa and Admin.
Reliability Above Everything Else
Being an early-stage startup with an extreme pace of iterations and innovations meant that new features were being released sometimes even on a weekly basis. Despite this, Luppa had already completed millions of surveys and had to offer analytics in real time.
Therefore, any errors were unacceptable, as they could result in the loss of valuable client data or incorrect data being reported. Because of that, it was important to create a reliable and bulletproof core that, despite fast iterations, would always be stable, up, and tested.
Tech Stack
As the primary tech stack, we use PHP/Laravel deployed to AWS instances. This setup ensures scalability and at the same time provides us with a flexible stack. Laravel enables us quick iteration times, which is our primary goal. Besides that, business logic is highly and easily testable, ensuring accurate and reliable results.
Visualization
Luppa’s tagline is: “Google Analytics for Employee Satisfaction and Engagement”. Therefore, the main part of the product is graphs, or more precisely, 163 different graphs with all company data, as well as all benchmark data. Bar charts, pie charts, line graphs, Scatter, Area, and Bubble, are just some of the different types of graphs.
We wanted to create a report that:
- Is easy to use, informative, with clear user interface
- Has deep segmentation — 20+ different filters to filter different segments of data
- Has a super fast interface with data cache
- Has a system with 100% uptime
To achieve this, we developed two layers of data: one initial with the whole dataset, a second with filtered data for speed. To generate graphs we used customized MySQL tables to show all kinds of graphs but with preload and cache for higher speed.
Using pre-calculated data has enabled us to drop some queries from a couple of seconds, down to a few milliseconds. That not only made for faster graph visualization for the end user, but drastically reduced the load on our servers.

Cue In AI
Luppa’s clients’ main pain points are employee churn and disengaged employees. To solve this, employee satisfaction analytics is a super important step, but that is just the first step in solving this issue. The second step is to figure out what to do with results — make an action plan and execute it. To solve this part, internal or external HR experts are needed, but they can be costly, slow, and overall a non-scalable solution for big enterprises, especially when taking into account oscillating knowledge and quality.
The big idea behind Luppa AI is to use all data to generate action plans to increase employee satisfaction and engagement or reduce employee churn.
This means we had to utilize:
- All client data
- Team metadata (industry, size, market, etc.)
- All other Luppa data
- Luppa industry and market benchmarks
After rounds and rounds of testing, OpenAI seemed to provide the best results. The difference between 3.5 and 4 was so insignificant that the final verdict was to go with GPT 3.5.
We kick-started this process with predictive analytics modulus and developed algorithms to detect churn, burnout, quiet quitting risks, DEI, and culture indexes.
The next step is to create real action plans for the whole company, team or any other filter used for the whole data set or just one dimension.
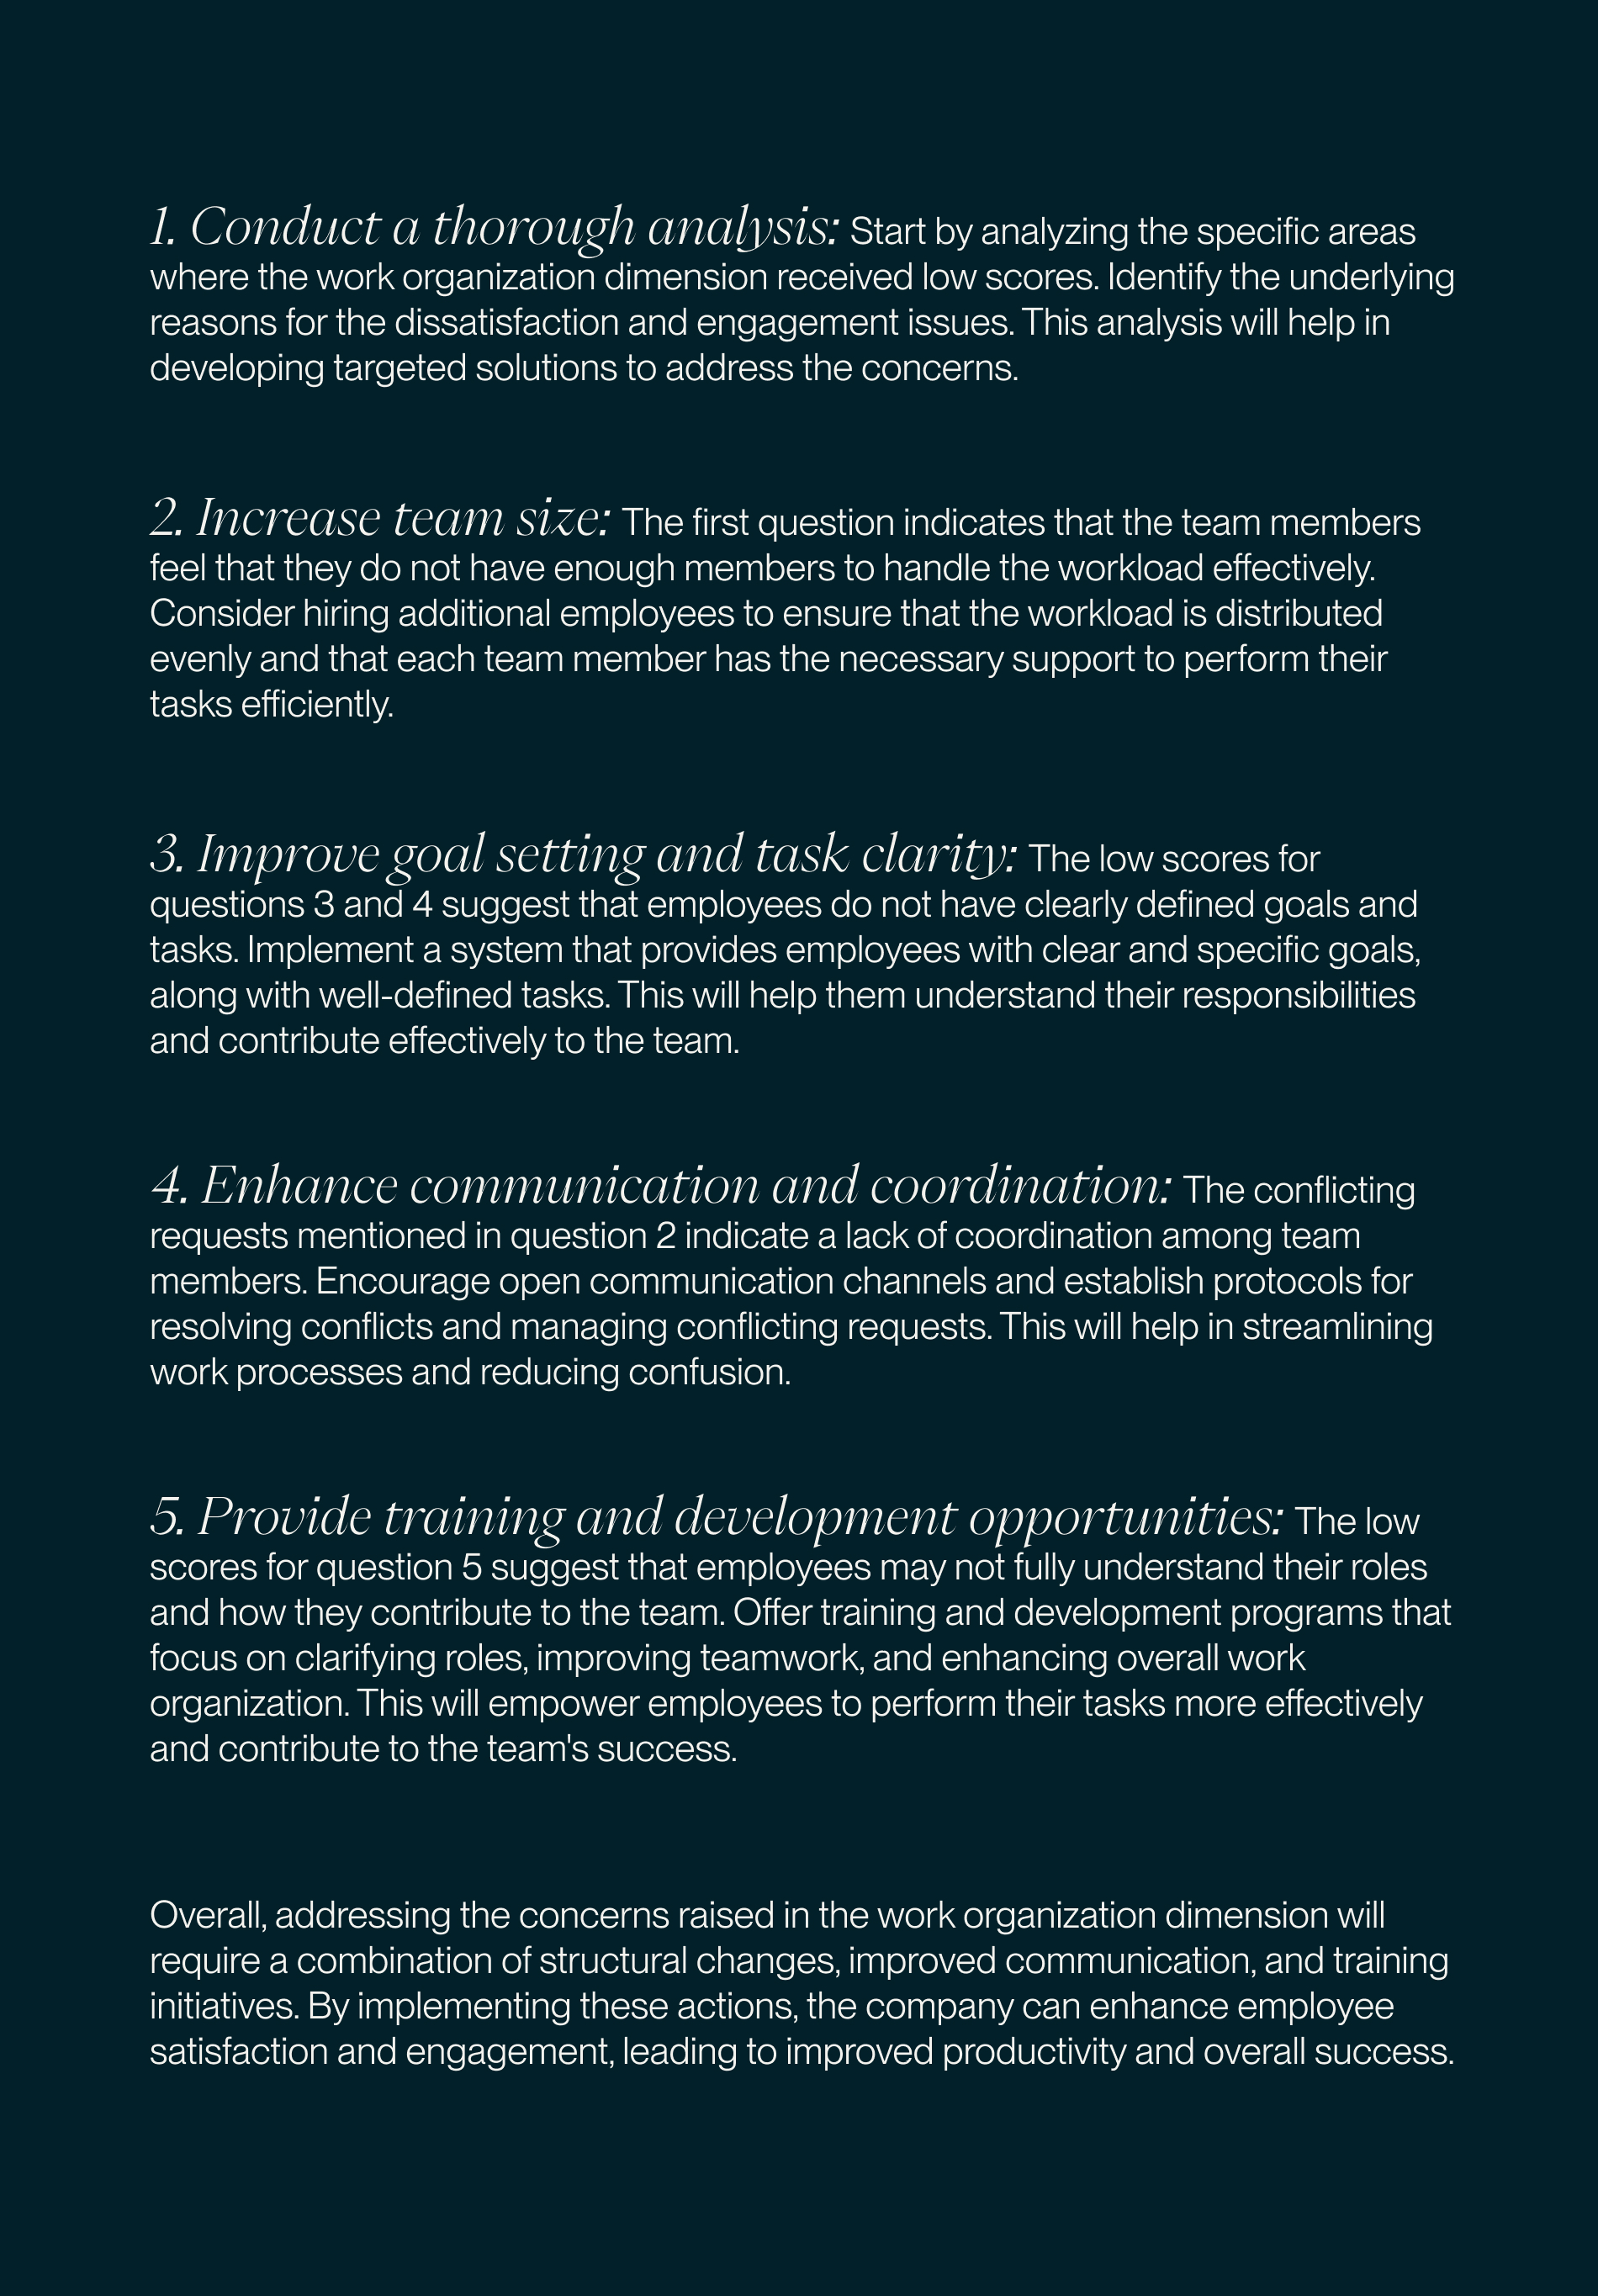
Wondering what this would look like? Check out the generated action plan for IT team of 20 employees for the work organization dimension.